
performance
Stop guessing from CPU charts — start with wait time
Busy servers aren’t always the problem. Ranking SQL by wait impact changes which statements you fix first.
CPU charts are comforting because they are simple. They are also a weak place to start when a workload feels slow. A server can look “busy” while the real pain is lock waits, IO stalls or log flush delays — and a quiet CPU chart can still hide queries that burn users with long waits.
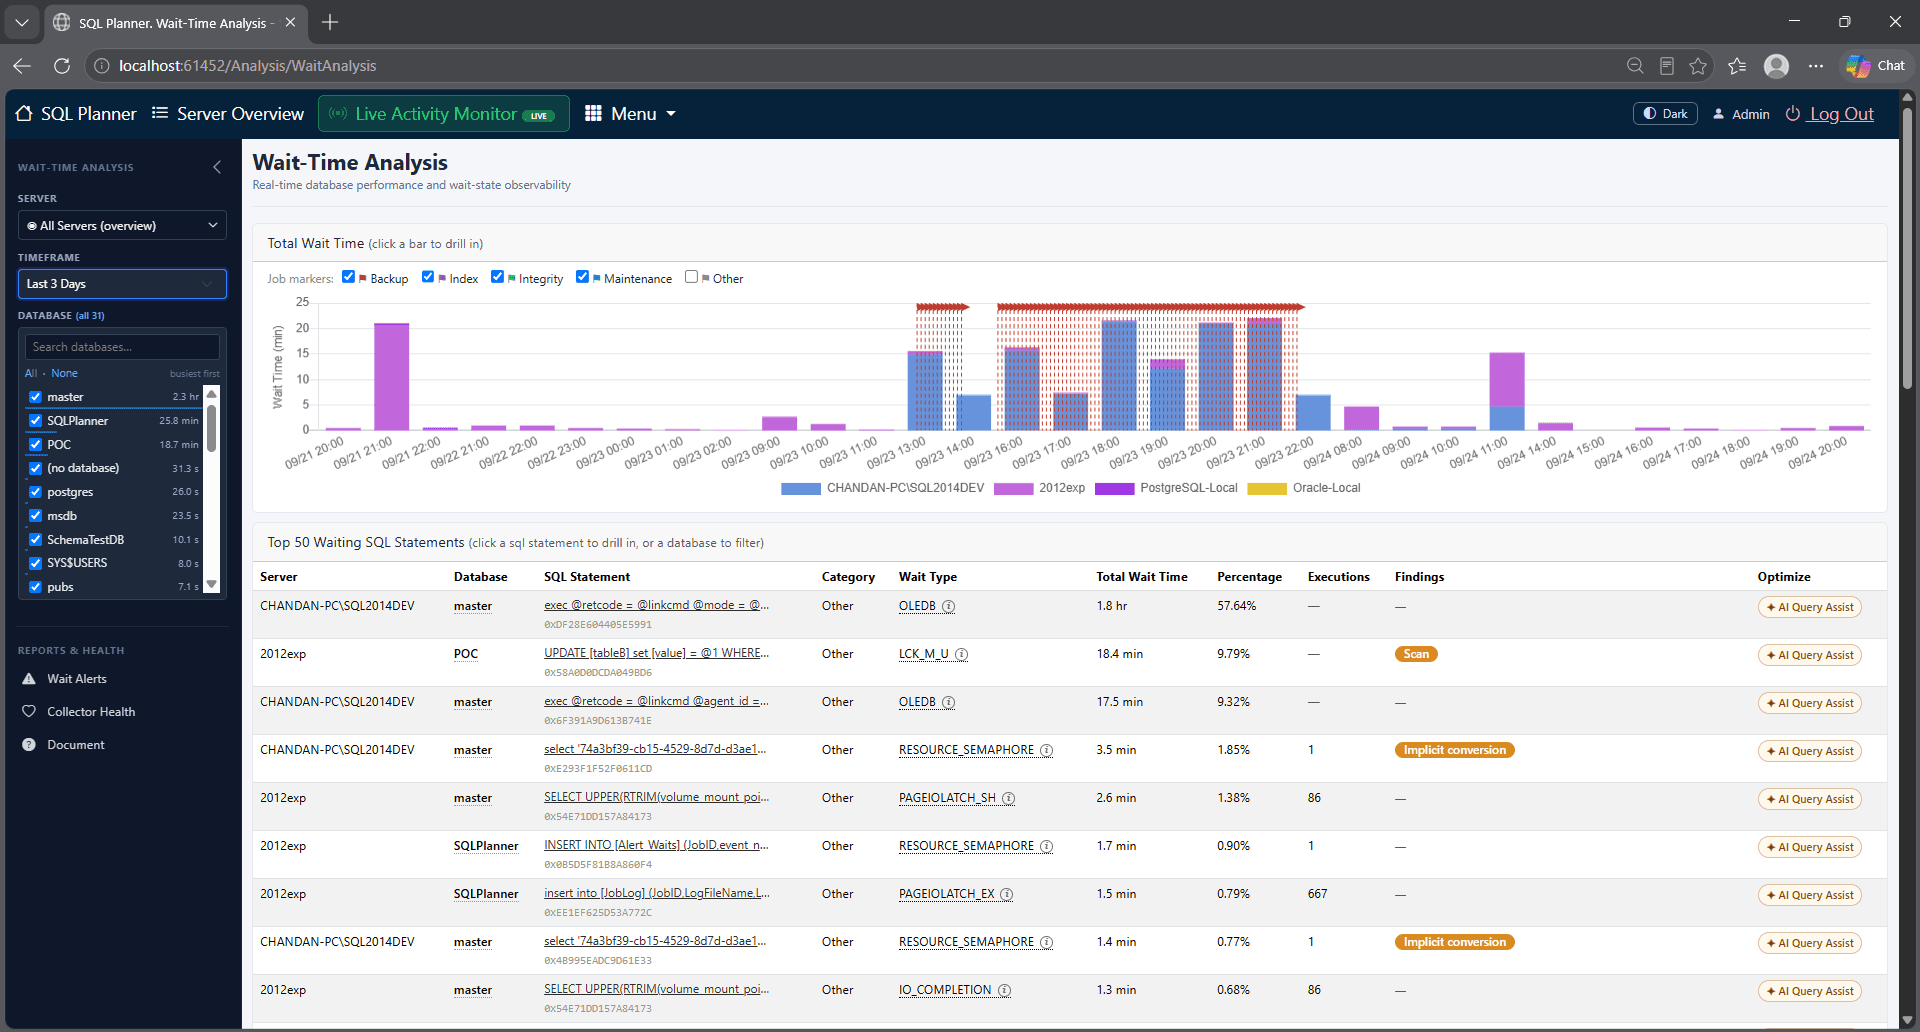
Wait-time analysis flips the question from “how hard is the box working?” to “what is SQL Server spending time waiting on, and which statements caused it?” That ranking changes which queries you open first and which indexes, plans or blockers you chase.
In SQL Planner, wait dashboards and drill-downs keep the wait type next to the responsible SQL text and history. The practical habit is: open the wait view for the incident window, take the top wait class, then open the top statements before you rebuild anything speculative.
When teams adopt that order — waits first, CPU second — tuning work becomes shorter and more defensible in post-incident reviews.
Prefer a walkthrough? Watch the latest product videos or book a demo.