
monitoring8 min
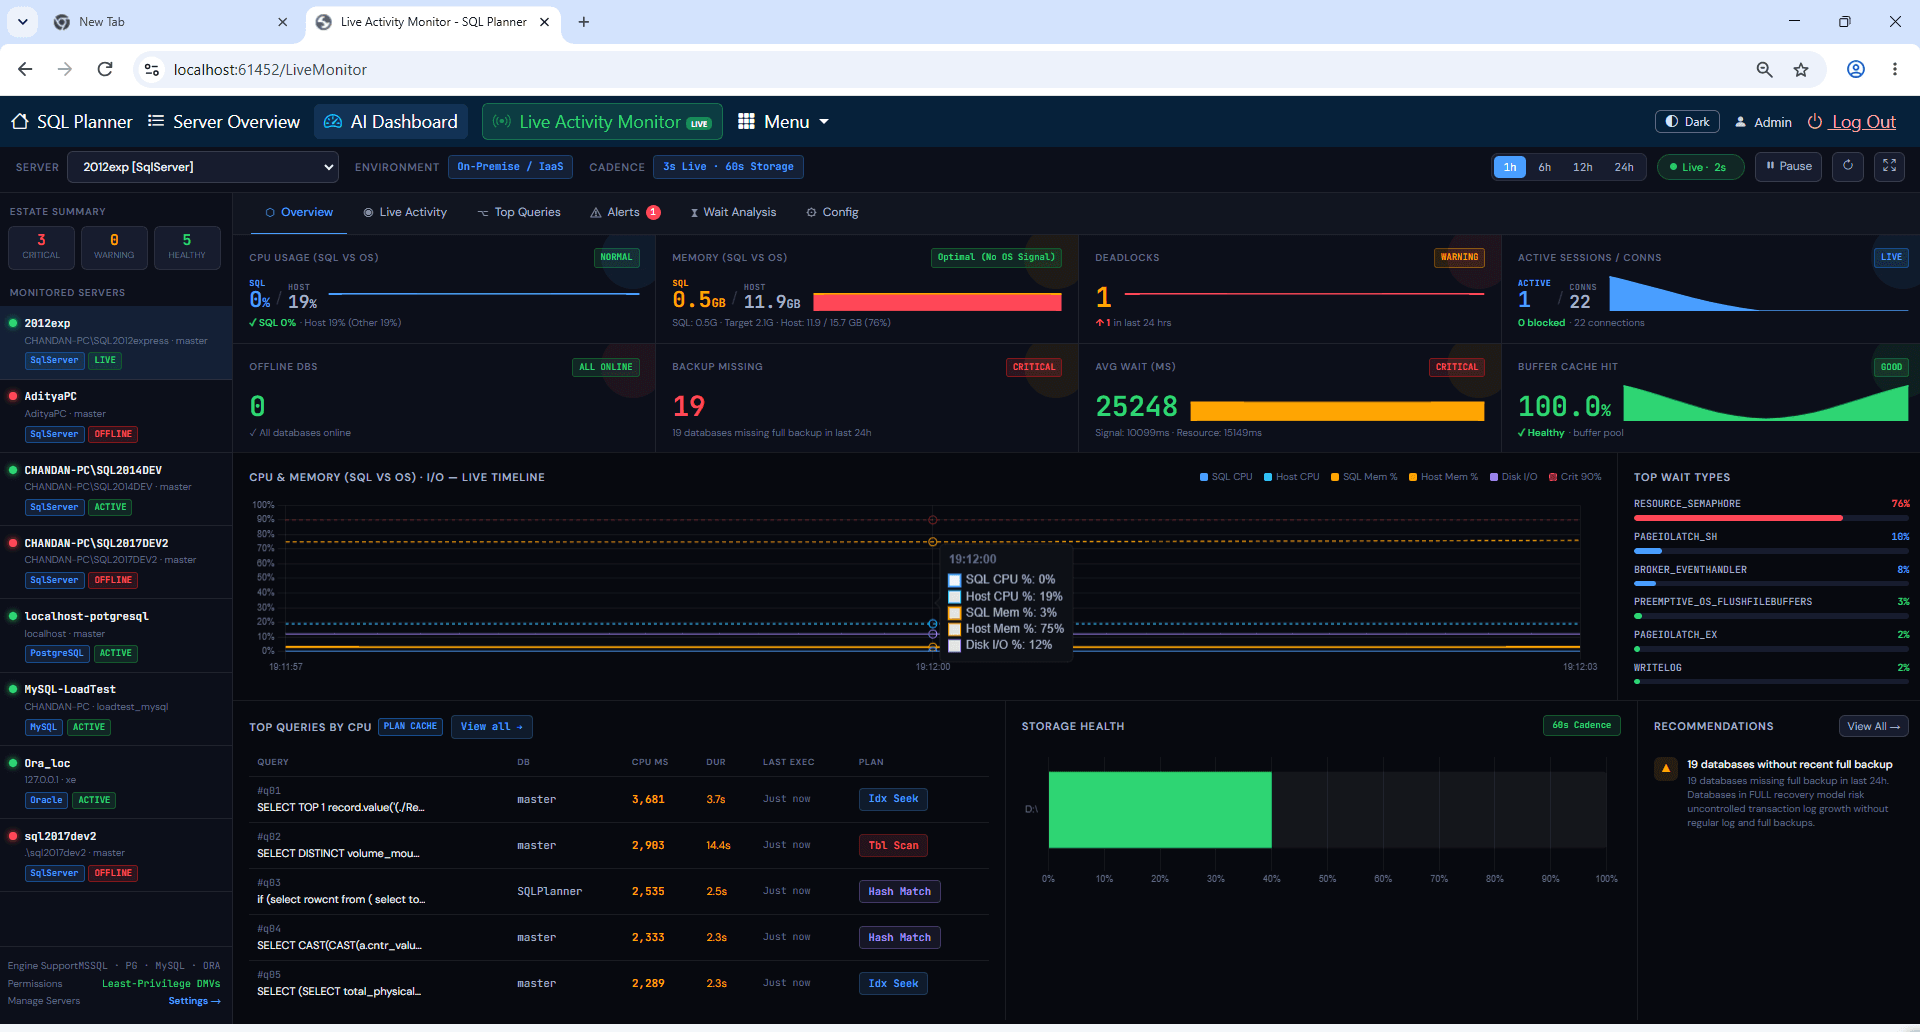
How to read the live SQL Server monitoring dashboard
A practical walkthrough of estate overview, live activity and wait signals so you know what deserves attention first.
Read guideDBA Guides
Short, actionable write-ups tied to real SQL Planner screens — monitoring, diagnostics, backup, management and Windows Server.
A practical walkthrough of estate overview, live activity and wait signals so you know what deserves attention first.
Read guide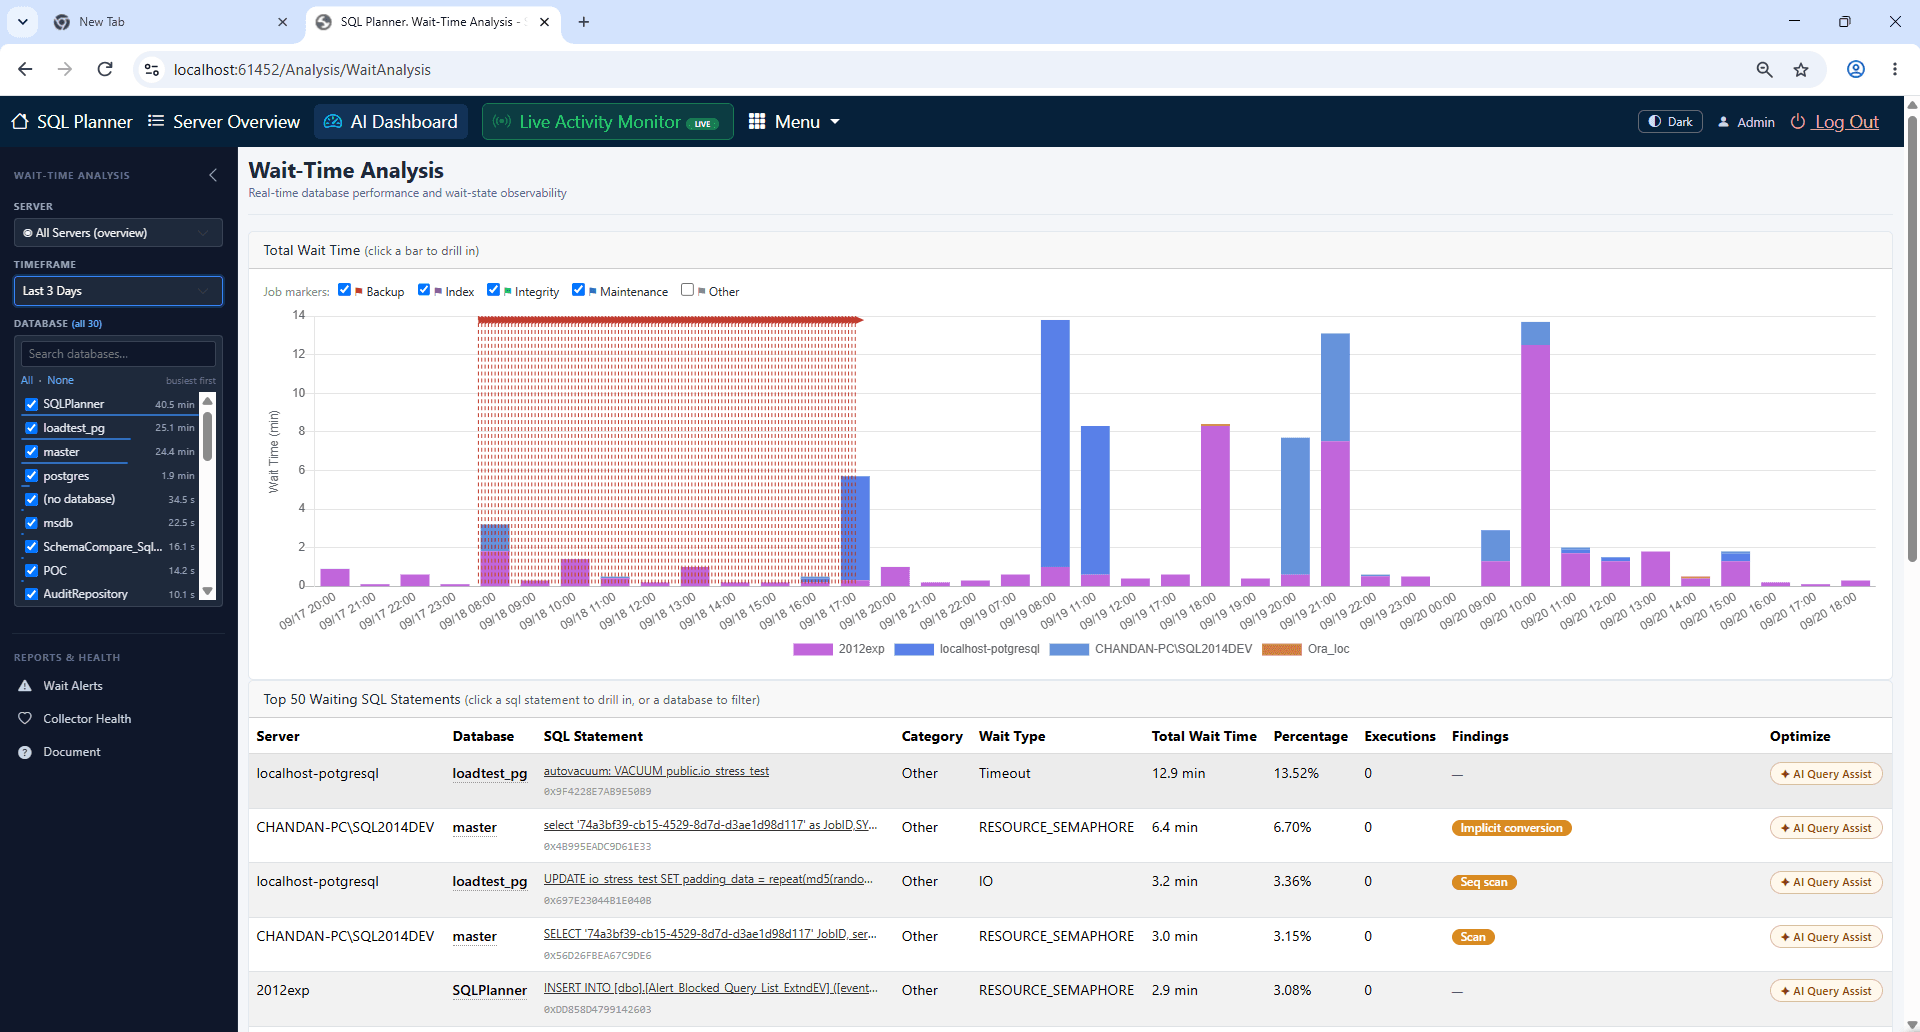
Rank statements by user impact, open the plan, and validate the fix — without guessing from CPU charts alone.
Read guide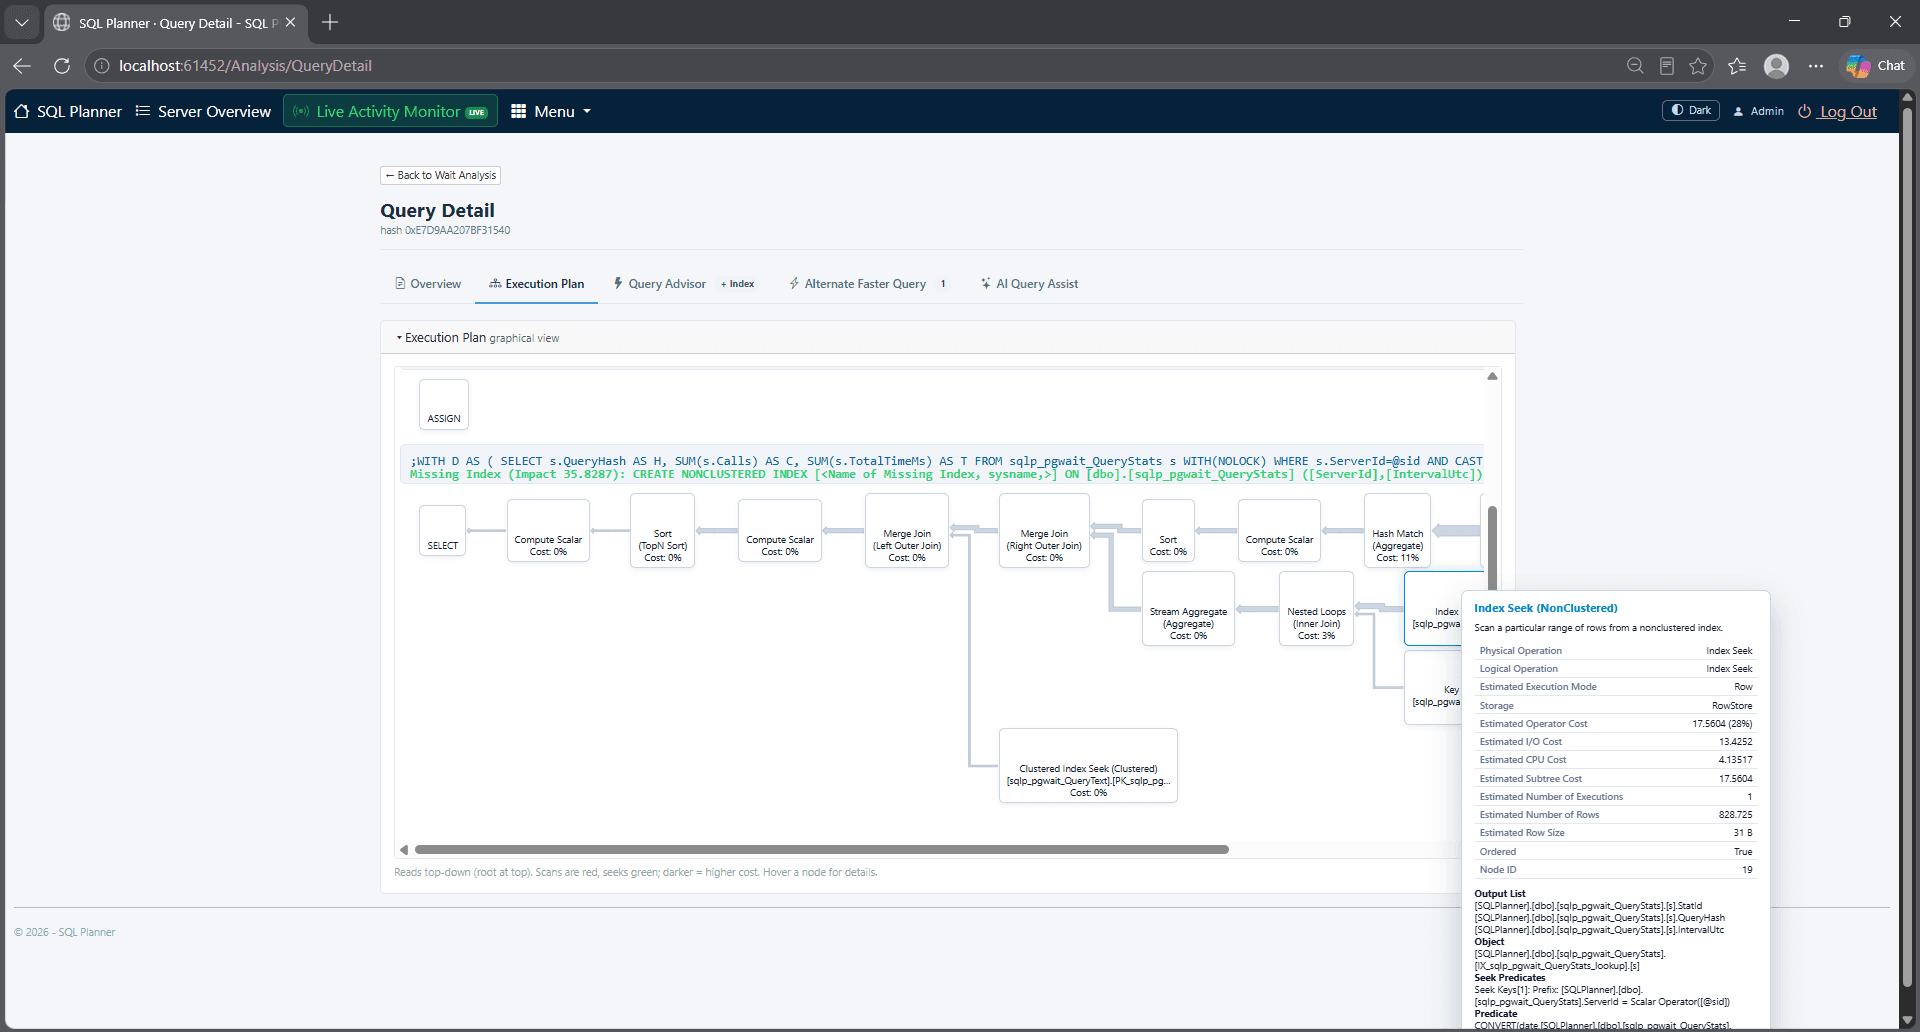
What to look for in operator trees for SQL Server, PostgreSQL, MySQL and Oracle inside one console.
Read guide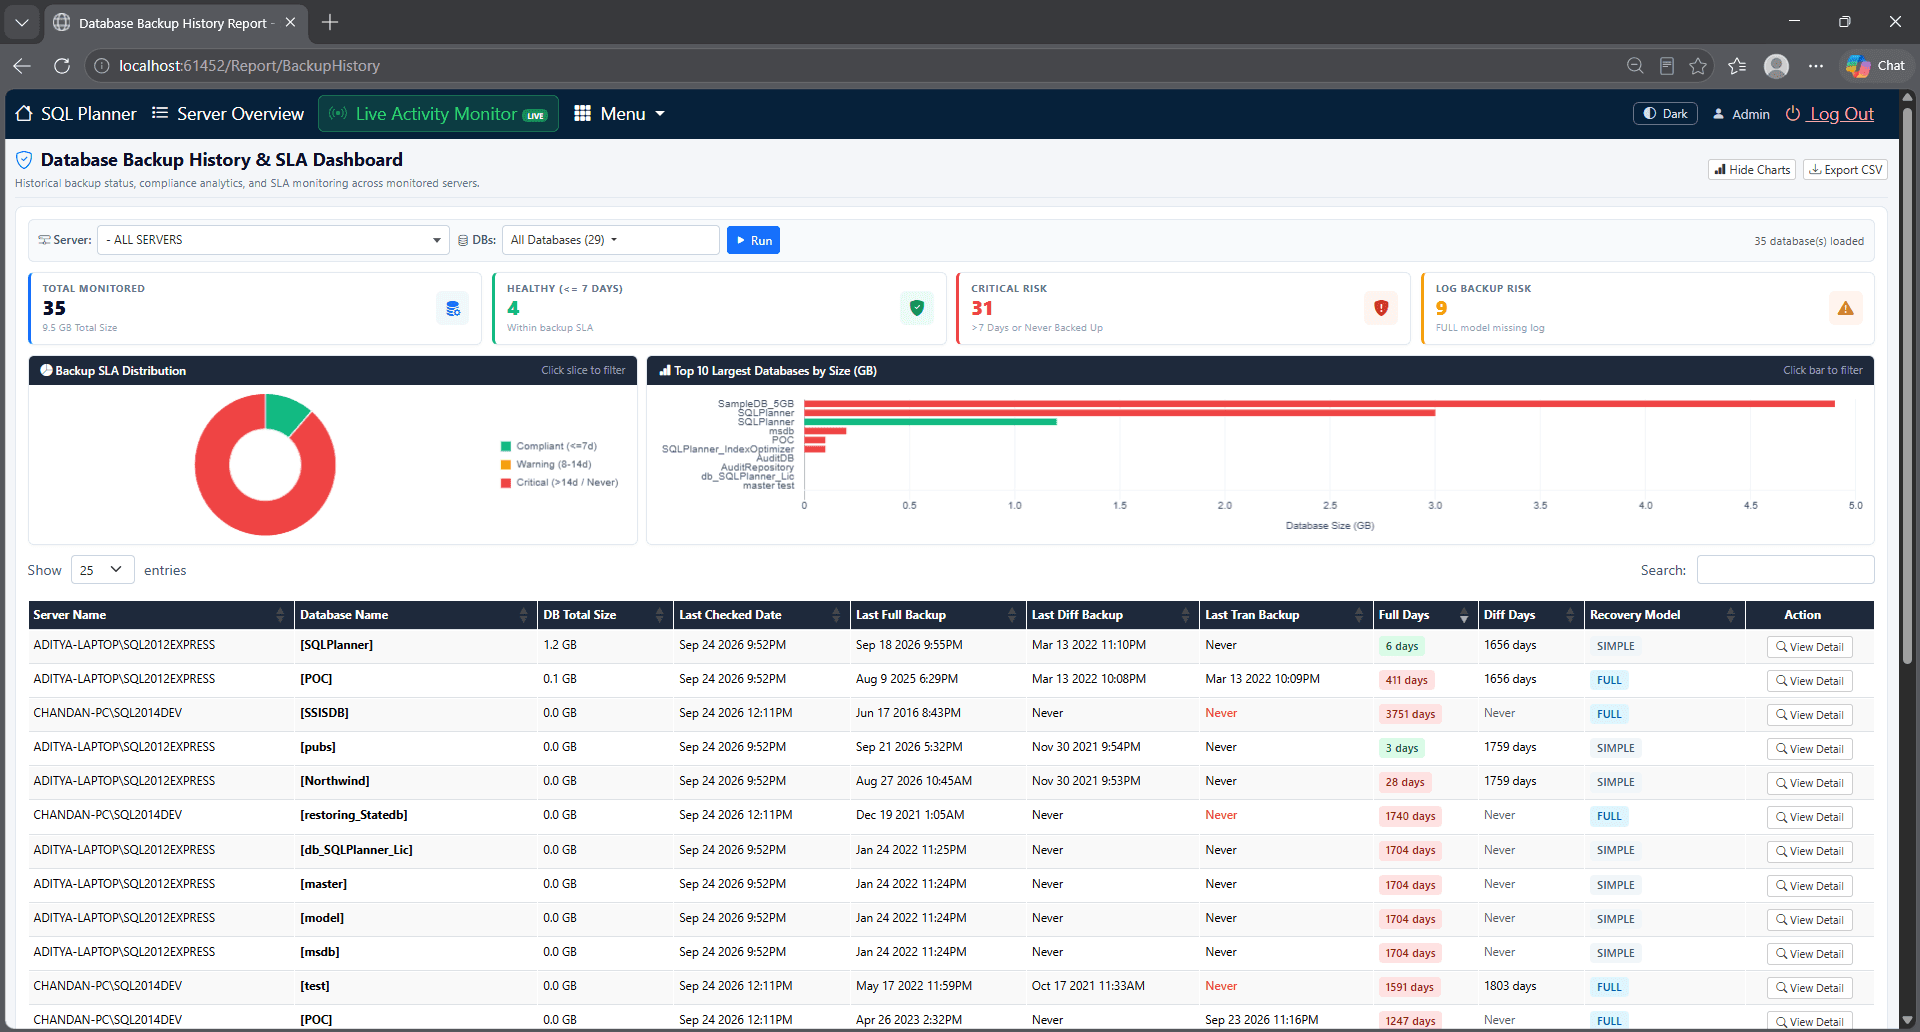
Use backup history dashboards to confirm success, spot gaps and keep recovery confidence high.
Read guide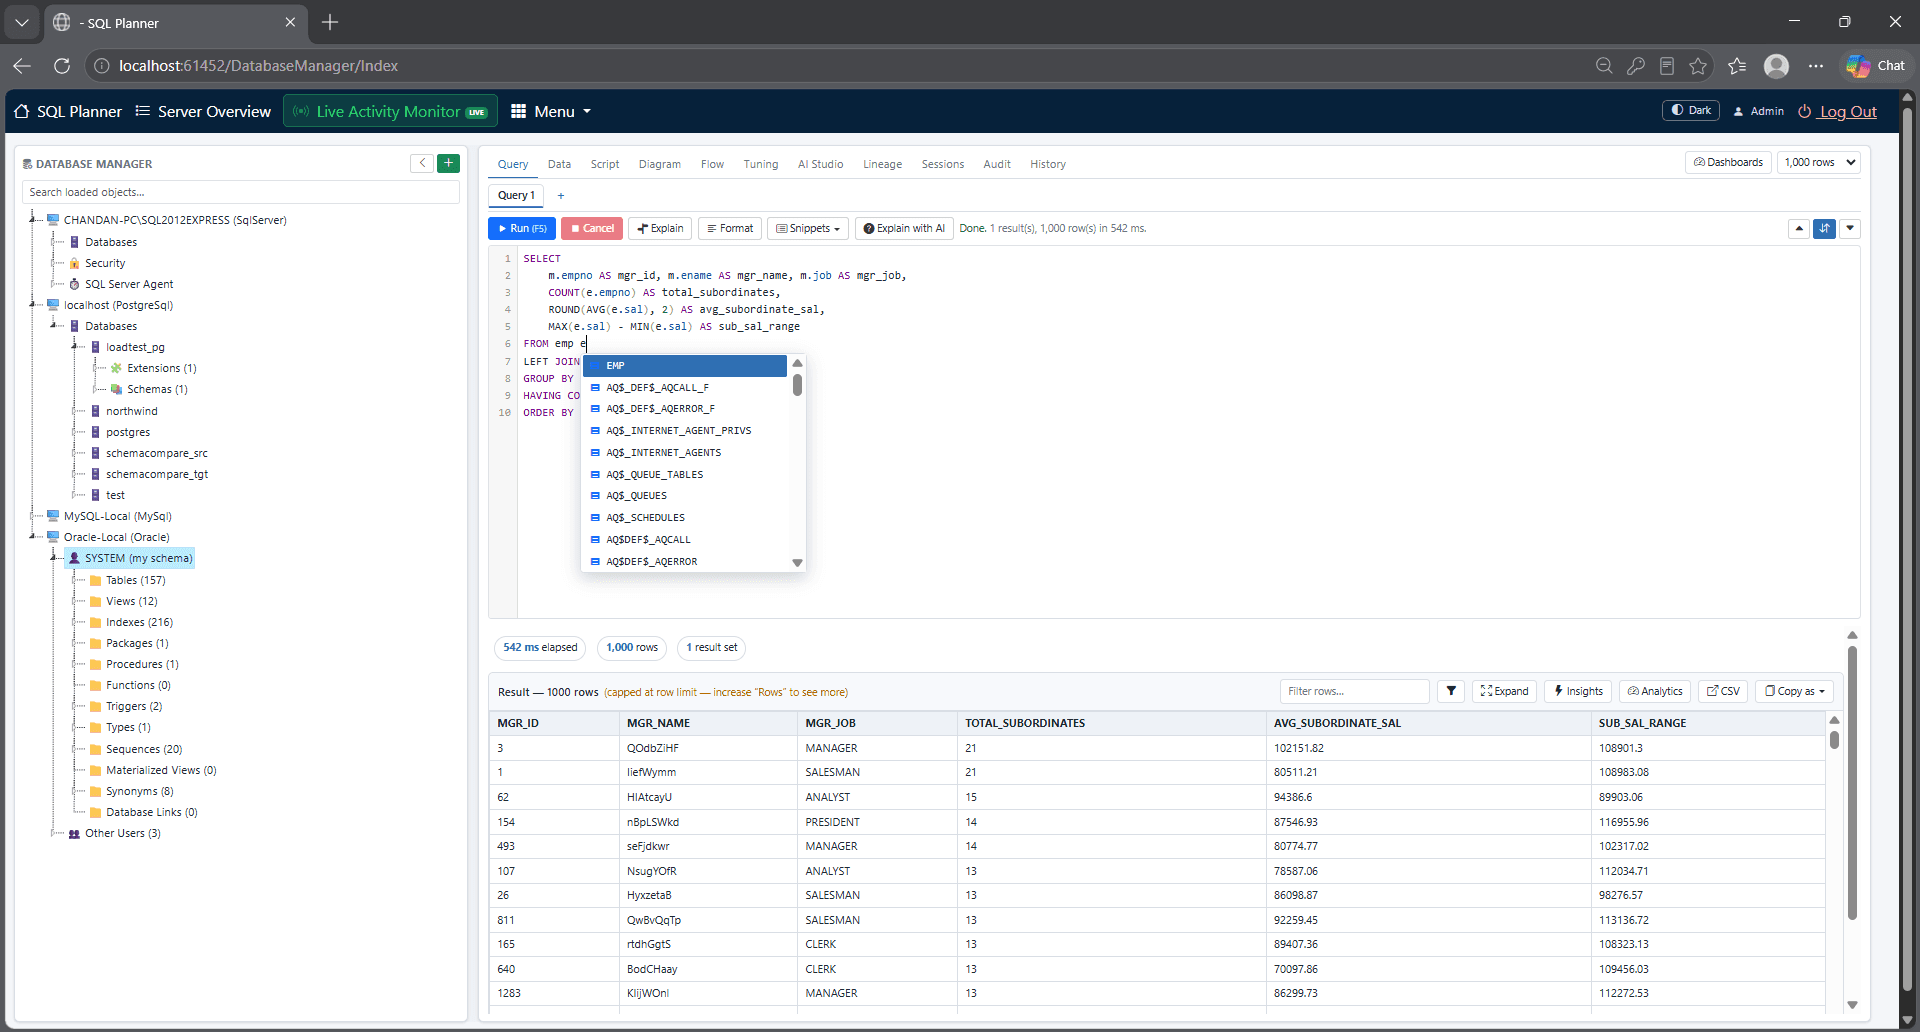
Connect SQL Server, MySQL, PostgreSQL and Oracle, keep history, and govern who ran what.
Read guide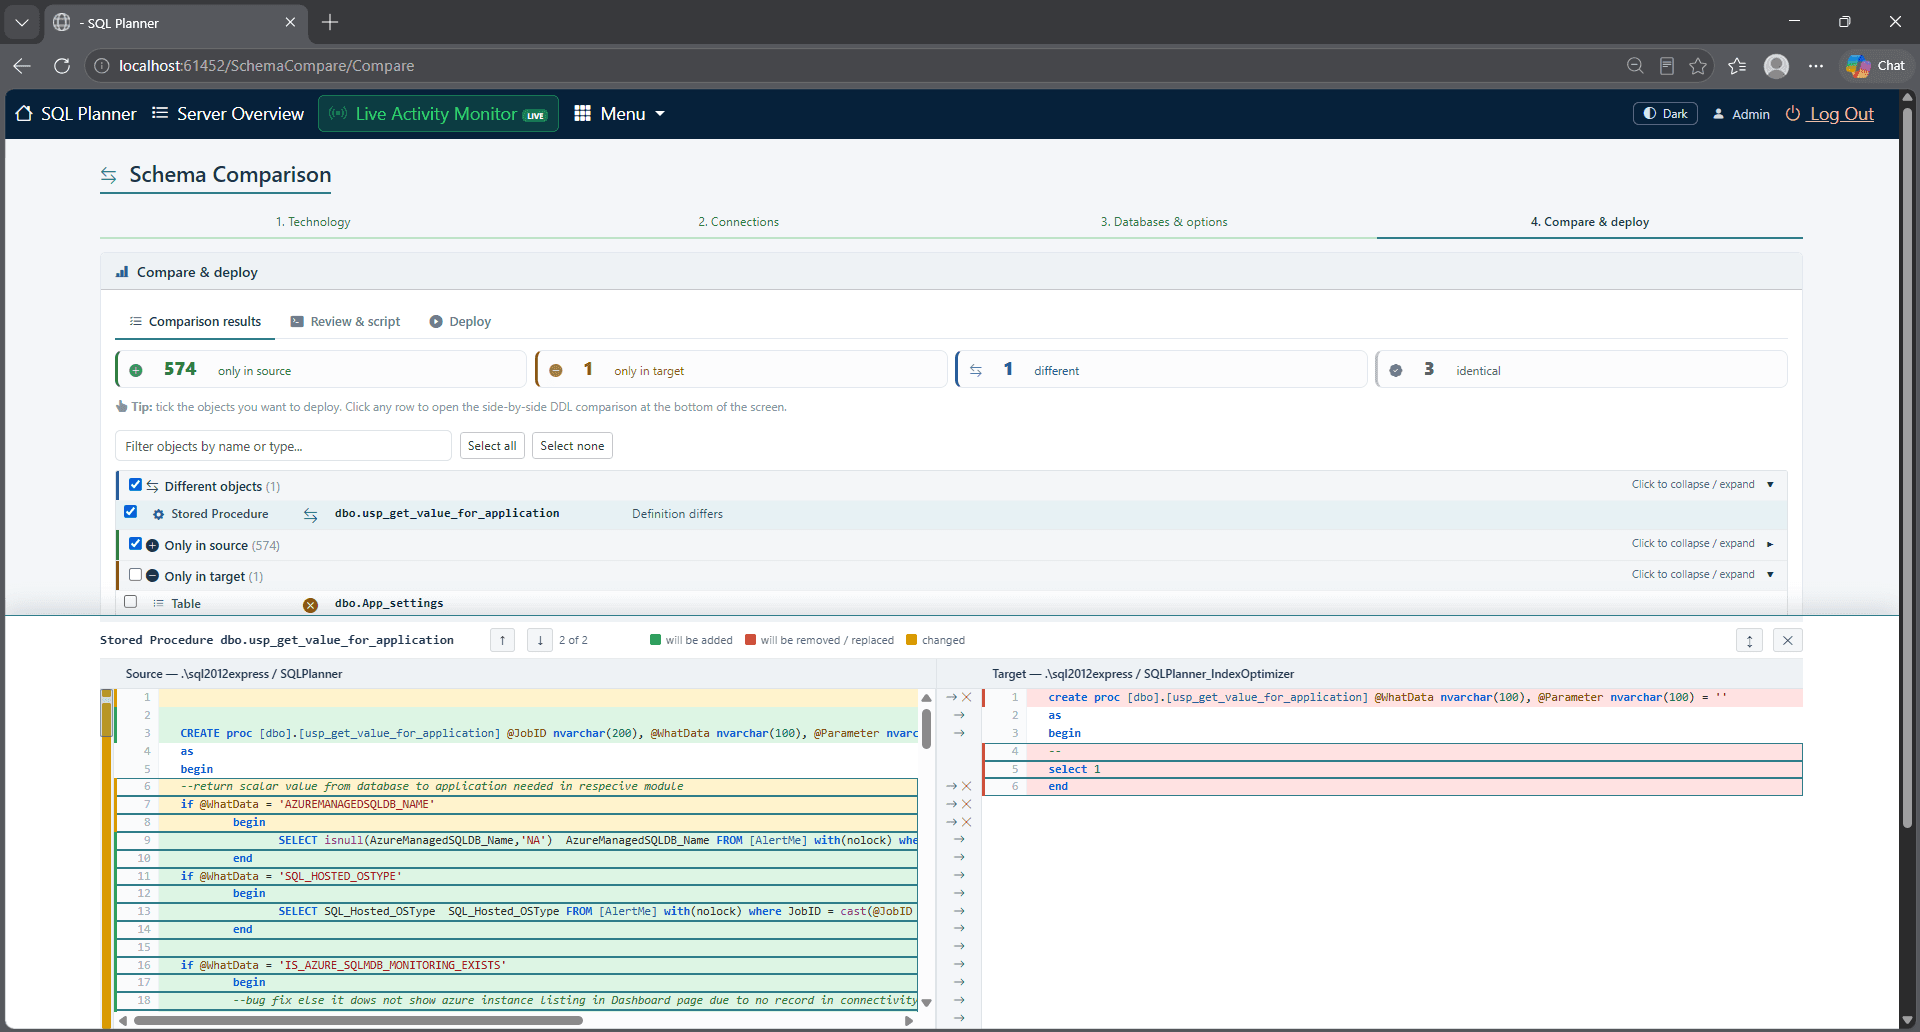
Compare DDL side by side, review the native script, and avoid lowest-common-denominator migrations.
Read guide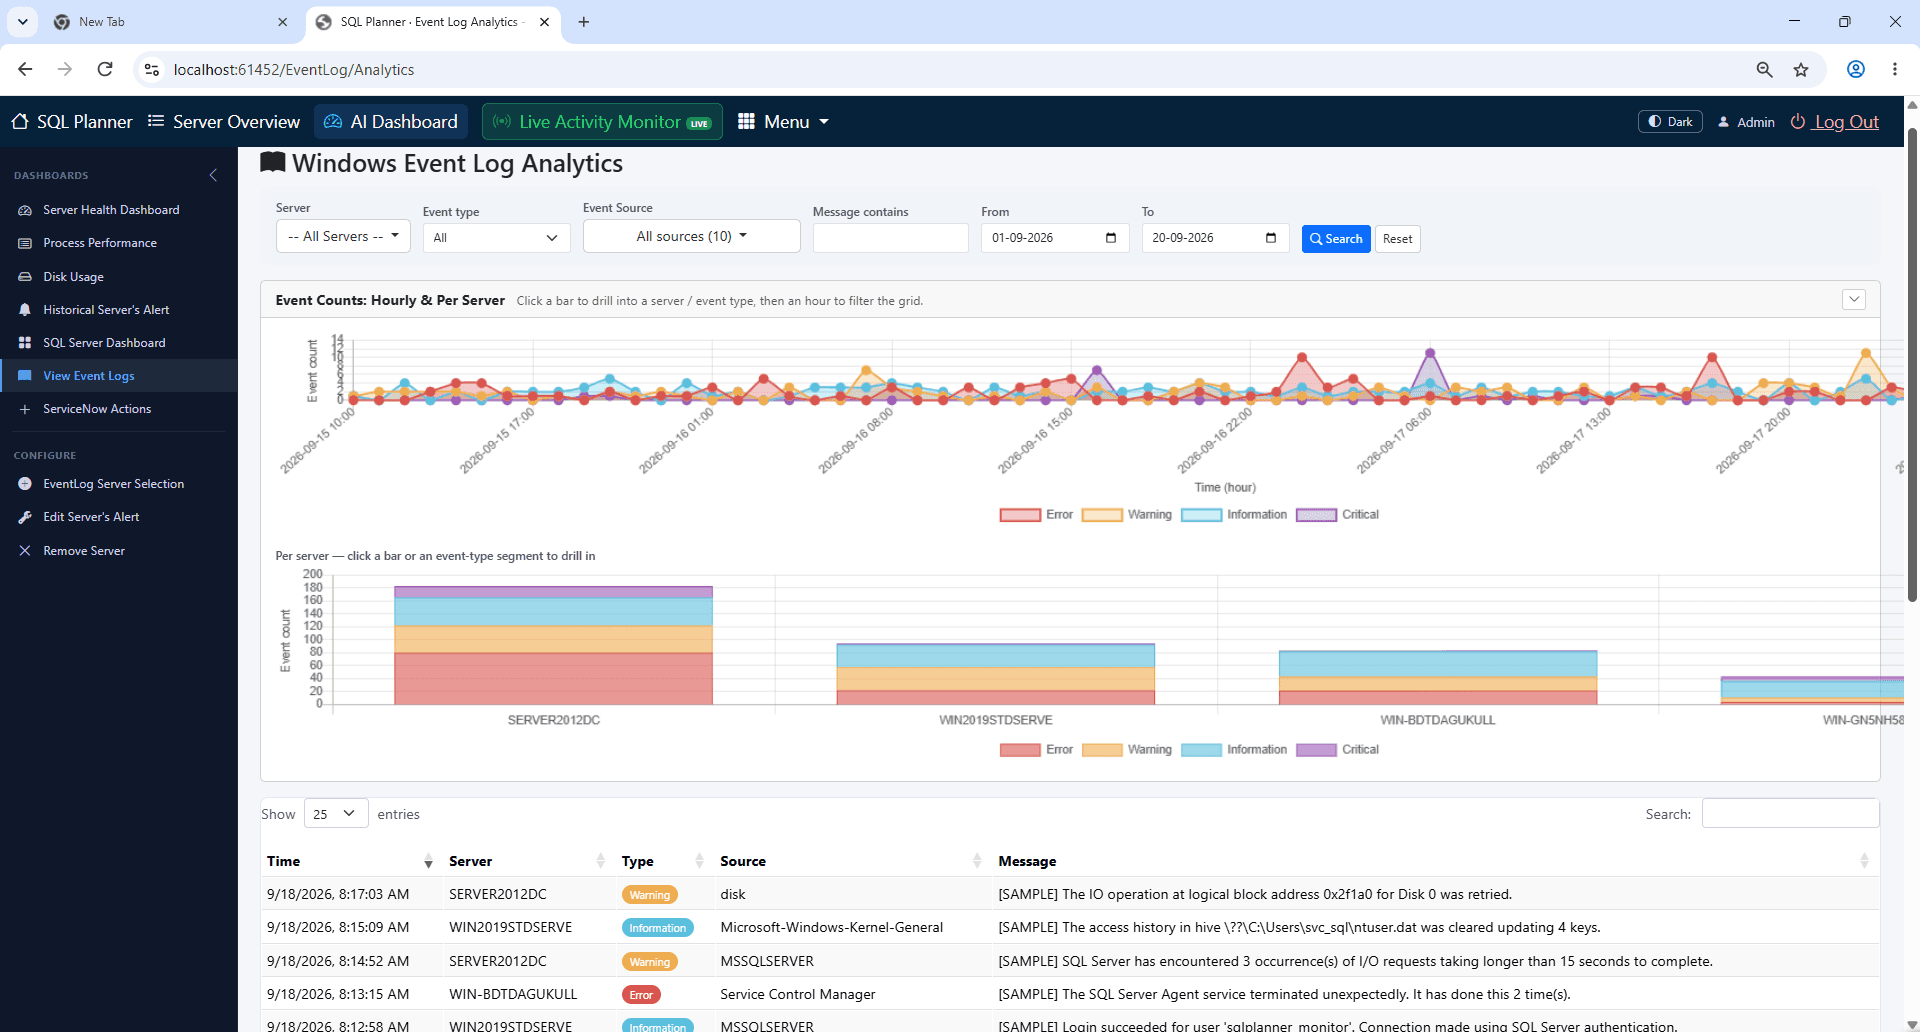
Correlate host event logs with database symptoms when CPU, memory or disk are part of the story.
Read guide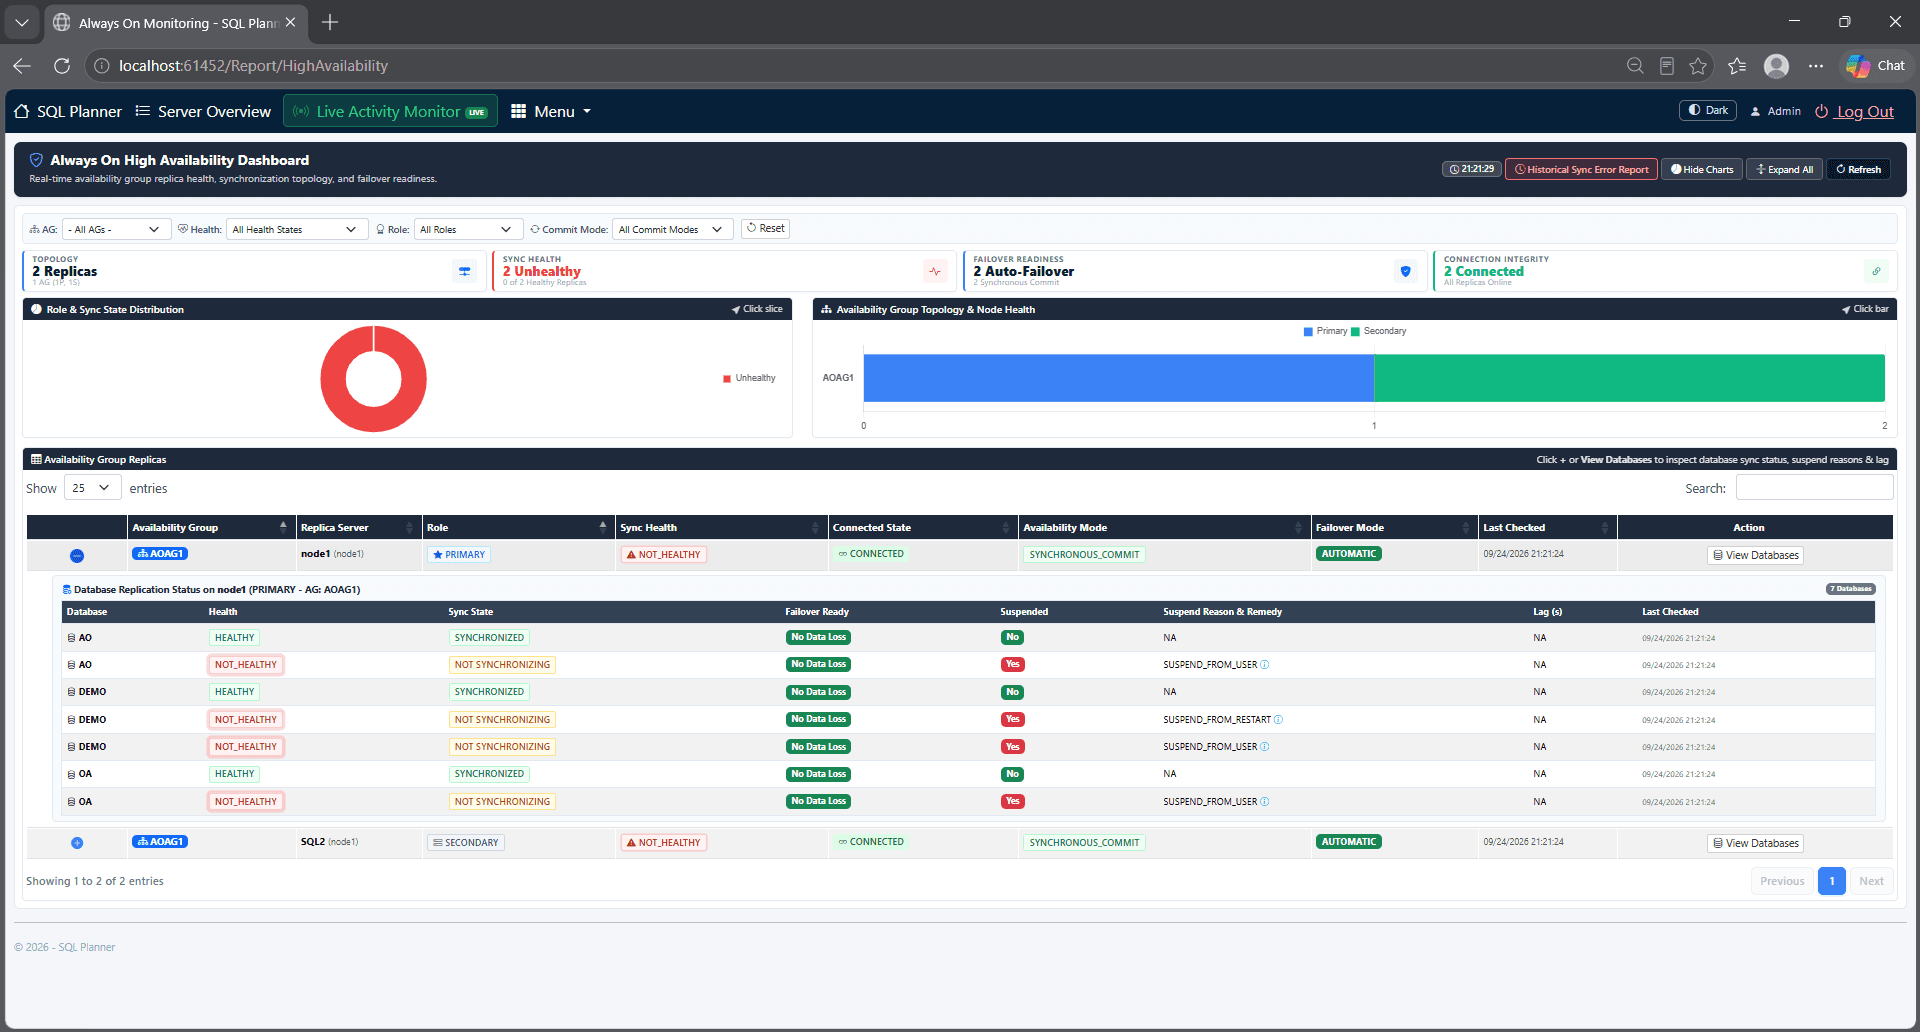
What to monitor on availability groups so failover risk shows up before users feel it.
Read guideKeep an operational trail when multiple engineers share Database Manager access.
Read guide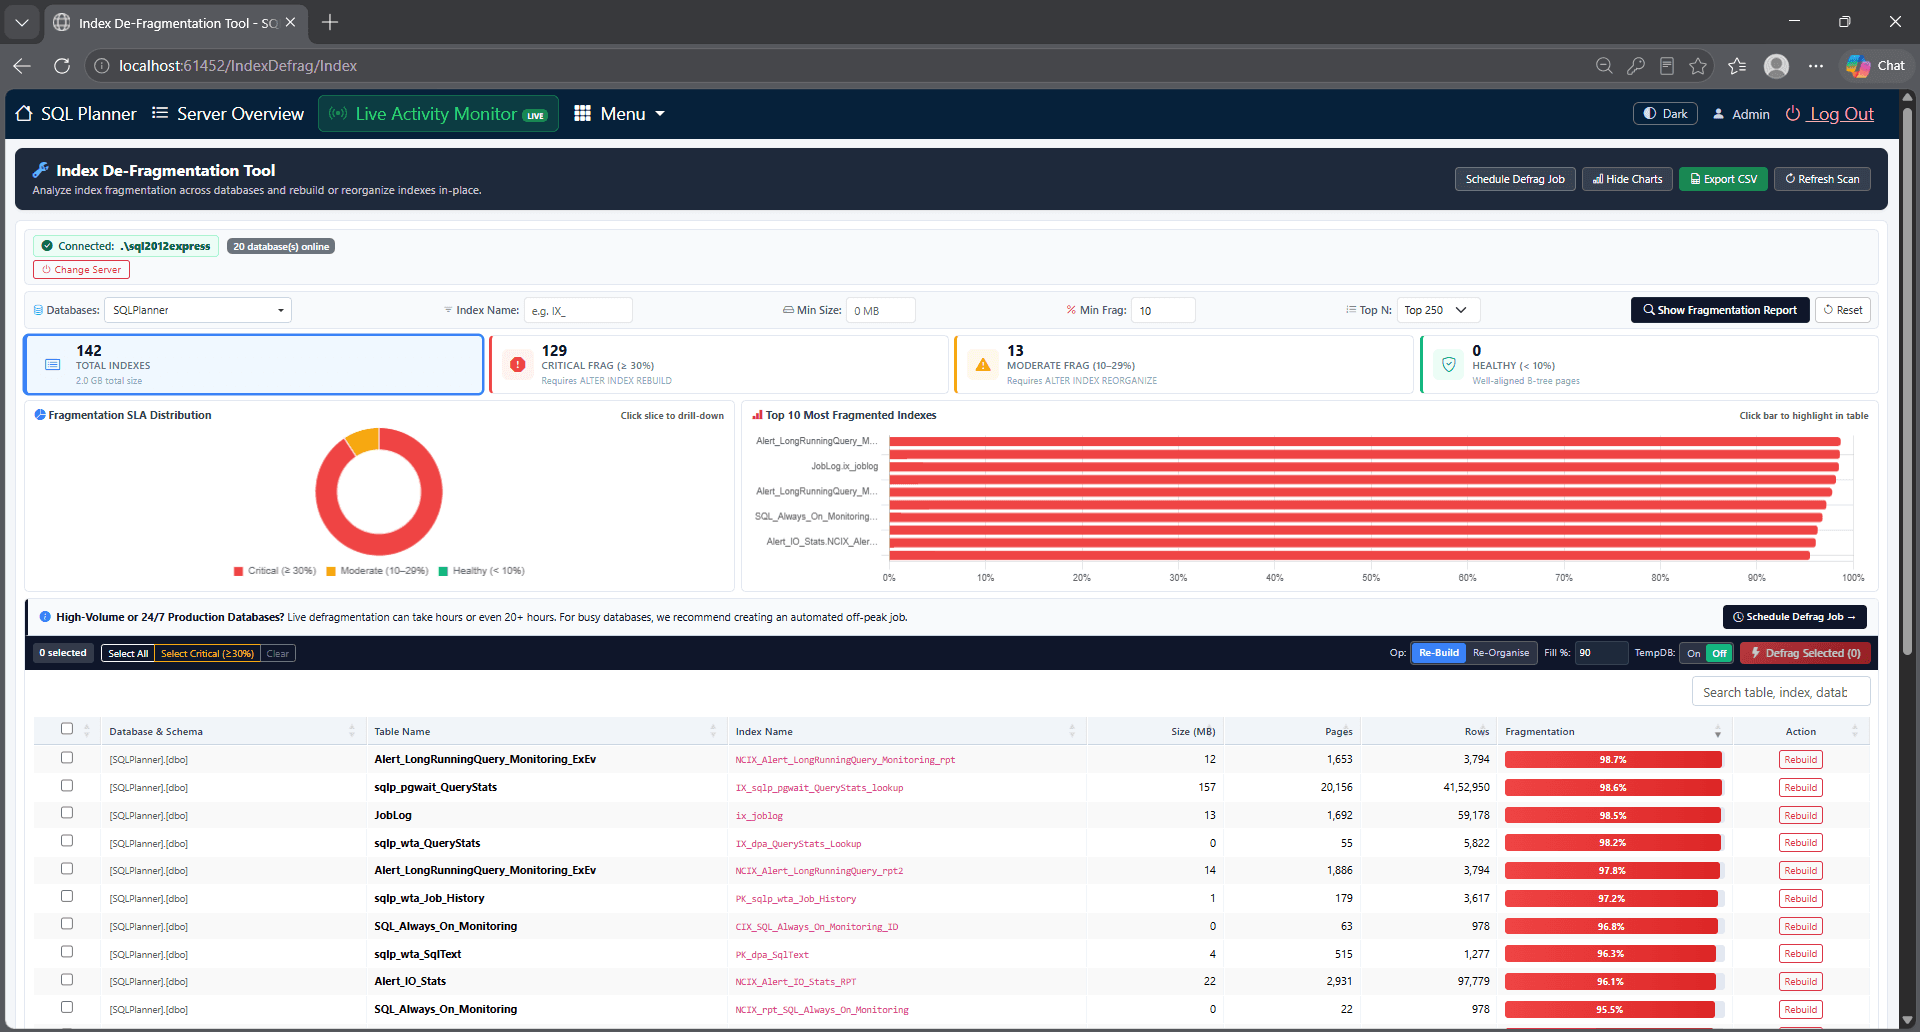
Use fragmentation reports to prioritize rebuilds and reorganize work without boiling the ocean.
Read guidePrefer structured docs?
Open Documentation