
operations
Windows signals belong next to SQL health
Disk, memory and event logs explain a surprising share of “SQL is slow” tickets. Keep them in the same workflow.
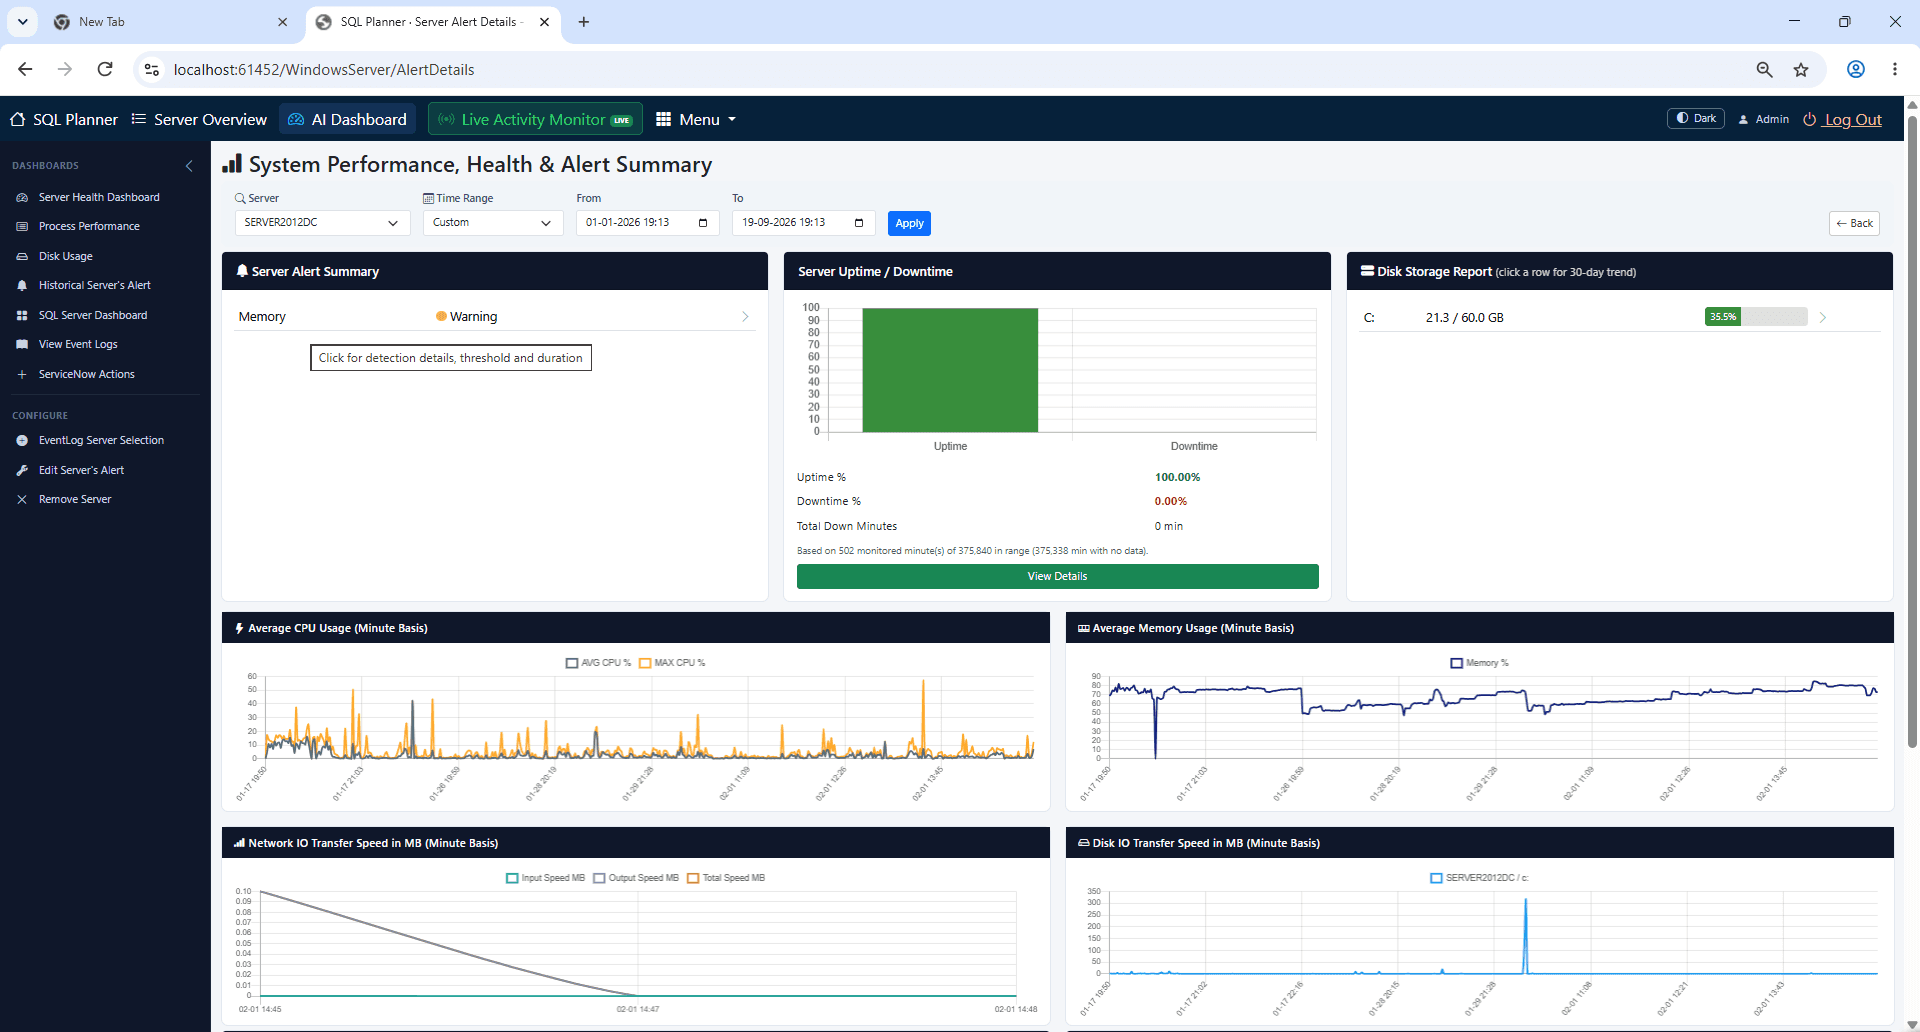
Many tickets labeled “SQL is slow” are host problems wearing a database costume. Low disk free space, memory pressure, service outages and noisy event logs often explain the symptom before a single query change would help.
When Windows monitoring lives in a separate tool from SQL monitoring, those correlations arrive late — usually after someone pastes screenshots into a chat thread. Putting Windows Server health, disk alerts and event logs next to SQL dashboards shortens that loop.
SQL Planner’s Windows Server monitoring is designed for that adjacency: resource trends, alerting and event log analytics in the same product your DBAs already use for SQL Server health.
For the next “SQL is slow” call, check host disk and services in the same session as waits and top queries. You will close a surprising number of tickets without touching application SQL.
Prefer a walkthrough? Watch the latest product videos or book a demo.